Planning for retirement requires us to make assumptions about future investment returns and inflation rates. What’s the best way to do that?
Many people start with history. For example, they may look up the long-term average return of the S&P 500 (around 10%-11% per year) and say to themselves, “Well, that sounds good!” However, there is one problem. Historical stock returns exhibit a large variance even over 20-30 year periods, so using an average return could lead to problems.
How much do stock returns vary? Below are the data on all the rolling periods from January 1956 to July 2021. The range of annualized returns for 20-year periods is 18.3% on the high end, and 4.8% on the low end. Shorter time frames are even more volatile:

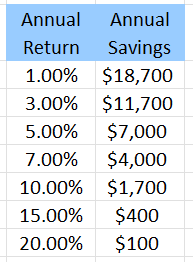
To illustrate the risk of being too optimistic with our return assumptions, let’s assume you just graduated from college. You are 22 years old and want to retire with $1,000,000. How much do you need to save each year if you want to retire when you turn 65? Well, the answer depends very much on the returns you can expect to earn in the future. Here are some example returns vs the savings required to meet the goal:
*results rounded
If you estimate that you’ll earn a 10% return on your investments, you only need to save $1,700 every year to get to that $1,000,000. However, a 7% return increases the savings target to $4,000 per year.
What happens if you plan on getting 10% returns and save the corresponding $1,700 per year, but returns end up being lower than you planned? Below are the predicted ending values of your portfolio under a variety of return assumptions:
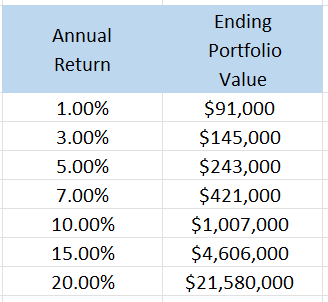
If you save $1,700 per year and only earn 7% on your investments, then you’ll end up with only $421,000. That’s a huge shortfall! The lesson here is to try to be conservative in your assumptions about the future. It also helps to follow the mantra, “Save as much as you can, as fast as you can!”
A better way
Estimating future returns and inflation doesn’t have to be complicated. In fact, more complexity is often useless when trying to make a guess about the future.
Stocks
For stocks, I like to use something called Bogle’s Method. This method is named for Jack Bogle the founder of Vanguard and the patron saint of everyday investors.
Here’s how it works:

We need to gather three variables:
Dividend yield: This is easy. From multipl.com, the current dividend yield for the S&P 500 is about 1.5%.
Earnings growth: Estimating the earnings growth rate is more difficult as there is a lot of variability in the historical data (and you can fall into the same trap that I mentioned before). To be conservative, I would use something around 5-7%. For our purposes here, I’ll use 6%.
% change in P/E ratio: You can assume the P/E ratio will revert to it’s long-term average. Again from multipl.com, the current P/E multiple for the S&P 500 is around 21. The long-term average is 15. If we are forecasting over a 10-year time frame, then the annual % change in the P/E multiple is -3.3%. [RATE(10,0,-21,15,0) = -3.3%]
Now we just add up the numbers:

Based on this method and current inputs, you could expect US large-cap stocks to return about 4.2% per year over the next 10 years.
Bonds
For future bond or bond fund returns, Bogle recommends using the current yield to maturity (YTM).
As an example, let’s look at the current YTM for the Vanguard Total Bond Market ETF (BND):

Based on this method, you can expect this broad market bond fund to earn around 3.4% per year for the next 10 years.
Inflation
To estimate future inflation, we can let the marketplace do the work. The market’s best guess of future inflation is embedded in the yields of regular US Treasury bonds and a US Treasury Inflation Protected Securities (TIPS) of similar maturity. Since the TIPS yield in net of inflation and the regular Treasury bond is not, we can calculate implied inflation by taking the difference between the two yields.
Using data from Bloomberg, the current YTM for the 10-year T-Note is about 3.0%. And the current YTM for the 10-year US TIPS is 0.4%. This gives us an estimate for 10-year inflation around 3.0% – 0.4% = 2.6%.
Many people will look at this estimate and say, “No way! That’s way too low!” And based on current inflation figures, they would be correct. But the market is looking at the next 10 years, not just at today. Obviously, the market’s guess about future inflation could be wrong (it certainly has been before). But as far as estimates of future inflation go, this is the best method that I’ve found.
A note of caution
Now that we’ve got our estimates of future investment returns and inflation, I would like to sound a note of caution.
Predicting the future is hard, if not impossible. The above estimates will almost certainly be wrong. But they can offer a rational starting point for planning purposes, which is the best we can hope for. I don’t know about you, but my crystal ball is as cloudy as ever.
A good way to help mitigate future uncertainty is to stress test your financial plan. This can be as easy as using a range of estimates in your planning and not just relying on a single one.
All financial advisors should have at least a basic set of capital markets assumptions and the ability to clearly explain how they created their assumptions. If your advisor’s assumptions don’t seem reasonable to you, don’t hesitate to push back or ask for more information. These assumptions can make big difference in your financial planning strategy, so please be sure that you are comfortable with them.
Other sources of estimates
If you don’t want to engage in the exercise of calculating your own estimates, you can get very sophisticated capital markets estimates from by Vanguard, JP Morgan, or other financial services firms.
The Vanguard Market Perspectives Report is updated a few times every year and offers a comprehensive look at expected returns.
JP Morgan creates a comprehensive guide each year that includes more estimates than you could ever need. Remember though that more complexity doesn’t necessarily make for better estimates.
Disclaimer: Performance figures contained herein are hypothetical and are intended for illustrative and educational purposes only. Past performance is not indicative of future results, which may vary. There is a risk of substantial loss associated with trading stocks, bonds, and other financial instruments. We cannot guarantee the accuracy of any calculations or third-party data used in these illustrations.