If you’re familiar with our fee schedule and general philosophy about investment costs, then you know that we hold a firm belief in reducing costs for investors wherever and whenever possible. We have posted a variety of illustrations showing the true cost of financial advisory fees, however, I thought it might be a good exercise to look at the cost of advisory fees from another perspective… how they can affect your chances of success in retirement.
Simulating Retirement
For better or worse, the industry standard tool for creating retirement projections is a statistical technique called Monte Carlo simulation. In a nutshell, a Monte Carlo simulation attempts to provide a statistical framework for looking at future outcomes. This is accomplished in a few steps:
- Gather relevant parameters around the simulation, including:
- The length of the simulation period
- Starting value of the investment portfolio
- The timing and size of cashflows during retirement
- A distribution of expected investment returns (mean return and volatility)
- Create a single “simulation” of the future retirement timeframe:
- For each year, pull a random return from the distribution of returns created in step #1
- Calculate the change in portfolio value from cashflows and investment returns
- Move on to the next year and repeat until you reach the end of the simulation period
- Repeat step #2 about 10,000 times.
- Determine if each individual simulation was a “success” or “failure”.
- Calculate an overall probability of success (i.e. # of successful simulations ÷ total # of simulations)
Drawbacks of Monte Carlo
There are some significant drawbacks to Monte Carlo simulations. The most important being the old saying, “garbage in, garbage out.” If your advisor uses bad or unrealistic inputs for the simulation, then it won’t be of much use to you.
Another drawback of Monte Carlo simulations comes from their reliance on the Normal Distribution to generate sample investment returns. In real life, investment returns are not normally distributed. In fact, many academic studies have indicated that investment returns follow something called a Power Law distribution.
The main difference is that the Normal Distribution will underestimate the frequency of very large moves in asset prices. The most notable example of this comes from “Black Monday”, October 19, 1987, when the stock market lost about 22.6% of it’s value in… one… day! Based on the Normal Distribution, a price movement of that magnitude can be expected to occur less than once over the entire history of the universe. So not very often.
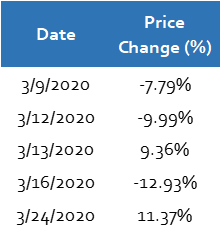
A more recent example comes from COVID. Take a look at this table of large price changes back in March 2020:

If you follow the Normal Distribution, then the expected chances of seeing price movements like this are so low that you could expect to never see them in a million lifetimes, yet there were 5 of them in a single month.
However, at the end of the day, Monte Carlo simulations are “good enough.” They can help illustrate areas of concern in a financial plan, but shouldn’t be relied upon exclusively when making planning decisions.
An Example
Let’s look at an example of a Monte Carlo simulation and compare how advisory fees can affect the model.
We’ll assume the following parameters:
- Starting portfolio value = $2,000,000
- Annual portfolio withdrawal = $80,000 (adjusted for inflation)
- Simulation length = 30 years
- Expected return = 6% (or 3.5% above inflation)
- Expected volatility = 11.4% (in line with a historical 60/40 balanced portfolio)
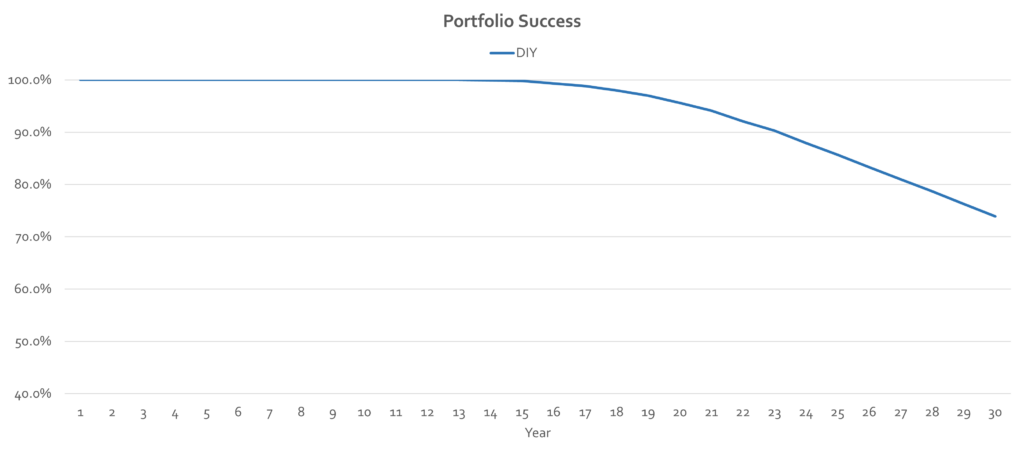
And here is the resulting graph of success probabilities for each year of the simulation:

As you can see, the first 15 years of retirement are a near certainty for success. However beyond year 15, the chances of success begin to drop steadily until in year 30 the simulation forecasts a 73.9% chance of not running out of money. In the grand scheme of things that’s pretty good. If you were in this situation, there are plenty of levers to pull (such as reduced spending or delaying Social Security) to increase the chances of success if you live longer than expected.
Advisor charging 1% of assets
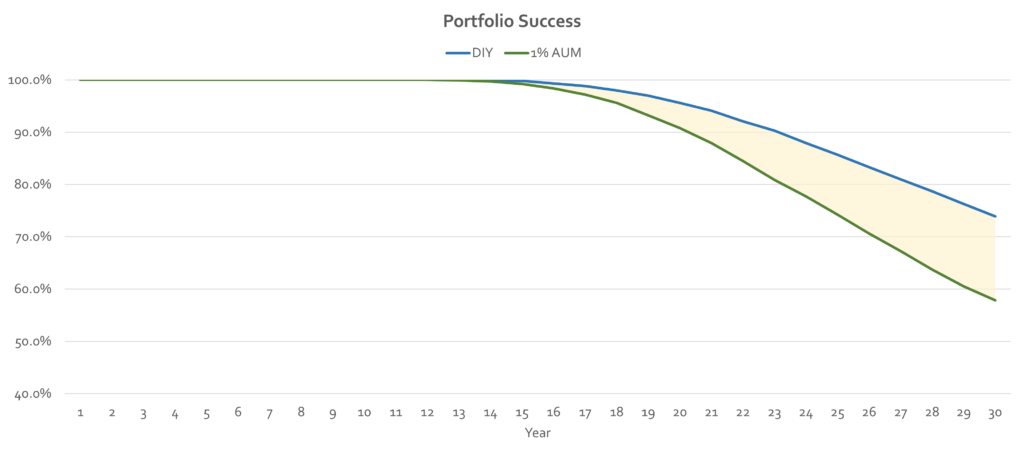
Now let’s look at what happens if you use the typical “1% of assets” financial advisor. All the parameters remain the same, except we reduce the expected return from 6% to 5% to account for the advisory fee.

In this case, the chances of success decrease much more quickly as the advisory fees eat into the portfolio returns. By year 30, the chances of success reach 57.8%… a 16% reduction from the DIY example.
Many advisors will argue that simply reducing the expected return by the cost of the advisory fee is an unfair approach. After all, the advisor ostensibly adds some sort of value in return for those fees. That’s not unreasonable. However, my main focus here is to highlight the cost of working with an advisor, not so much to convince anyone of the benefits of working with an advisor. After all, if someone chooses to work with an advisor, they obviously have made the determination that they get enough value to justify the fees paid.
What about us
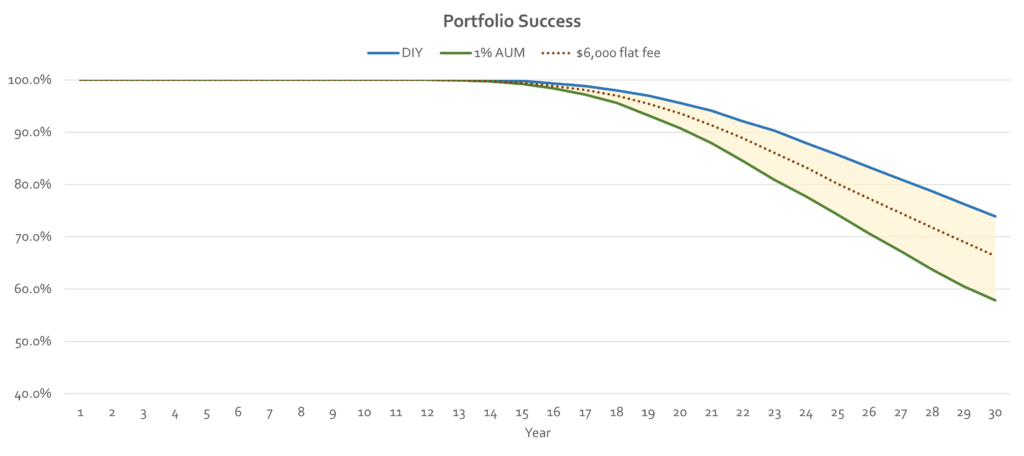
I would be remiss if I stopped here and failed to provide a comparison for our fee model as well. For this final simulation, I increased the expected return back to 6%, but increased the annual portfolio withdrawal from $80,000 to $86,000 (again, adjusted for inflation) to account for our fee. Here are the results:

In this case, our fee model splits the difference. At year 30, the simulation ends with a success probability of 66.3% or a reduction of 7.6% from the base simulation. Again, all else being equal, fees can have material impact on the success probabilities of the Monte Carlo simulation. But in this scenario, our fee model outperforms the standard advisory fee model by a substantial margin.1
The moral of the story
You’ll want to ensure that your advisor is accounting for their fee when performing retirement projections or Monte Carlo simulations. Many advisors will talk all day about the benefits and services they offer to their clients, but then they fail to reduce expected returns to account for their fees. This can result in an unreliable and overoptimistic analysis of your financial plan (aka garbage in, garbage out).
Be sure to walk through the major assumptions underlying any financial projections that your advisor performs on your behalf. If they don’t make sense, be sure to get some clarification before proceeding.
And at the end of the day, costs matter. If you choose to work with a financial advisor, be sure you are getting enough value in return for the costs incurred. Financial advisors can help out in a lot areas, but they aren’t for everyone. If you choose to work with a financial advisor, make sure they charge a reasonable fee. For most people, I recommend either a flat or hourly fee.
1 It’s important to note that our firm’s flat fee will offer more relative cost savings to larger investment portfolios. Investment portfolios less than around $500,000 – $600,000 could be better off working with an advisor using the typical 1%-of-assets fee, at least in the near term. But the advantage of a flat fee really kicks in as the portfolio grows over time either due to ongoing savings contributions or investment returns.

