A major part of the service provided by a high-quality financial advisor is tax planning and strategy. Often, this comes down to trying to figure out how embedded capital gains affect investment decisions. One powerful tool for analyzing your portfolio comes from something called the capital gains hurdle rate.
If you have been investing in a taxable brokerage account, it’s likely that you have a good amount of unrealized capital gains. For example if you bought $1,000 of Tesla (symbol = TSLA) about 5 years ago, then your investment is now worth over $23,000 today, so you have an “unrealized” capital gain of $22,000.
But how can you decide if it makes sense to sell your Tesla position, pay the taxes on the gains, and reinvest the remainder? Well, we start by calculating a capital gains hurdle rate. The capital gains hurdle rate represents the incremental return that a new investment would need to earn to justify the capital gains tax bill generated from selling an existing investment position in your portfolio. But how do you calculate the relevant hurdle rate? You need to start with a few variables:
- Estimated time horizon for the investment
- The current unrealized capital gain for the current investment
- Applicable capital gains tax rate
- Estimated future growth rate of the current investment
With these variables in hand we can perform the calculation in three steps. Here’s how it works:
Step 1 – Calculate the current tax bill
Using the example of the Tesla stock above, you have a capital gain of $22,000. If you are in the 15% federal capital gains tax bracket and you live in Virginia (5.75% tax rate), then your applicable tax rate on the gain is 20.75%. So you will end up paying $4,565 in tax ($22,000 x 20.75%). If you sell your Tesla stock today, you’ll have $18,435 ($23,000 – $4,565) left after tax.
Step 2 – Calculate the future value
Now, let’s consider what happens if you don’t sell the Tesla stock now. Take your estimated time horizon (let’s use 10 years in this case) and your estimated future growth rate for Tesla (let’s assume 10% per year). You can use the time value of money formula as follows:

r – growth ratet – time
So you can expect the value of your Tesla position to be worth $59,656 in ten years.
Step 3 – Calculate the breakeven rate
We can now combine the information from Step 1 and 2 and see where they meet. From Step 2, you have an expected pre-tax value of $59,656, but you need to adjust for the taxes you would have paid earlier if you had sold. So your target future value on a new investment would be $55,091 ($59,656 – $4,565). Now you can solve for the breakeven growth rate using another time value of money calculation:
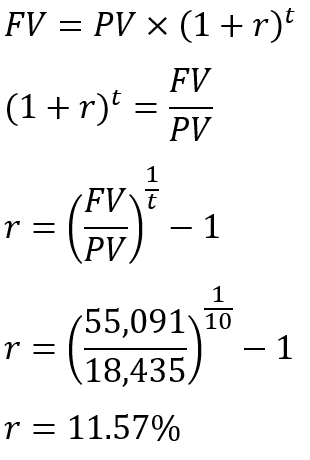
PV – present value
r – growth rate
t – time
So if the new investment grows 11.57% per year for the next ten years, then you’ll break even with your Tesla position growing at 10% per year. From there you can determine the capital gains hurdle rate = 11.57% – 10% or 1.57%. This means that any new investment will need a growth rate 1.57% above Tesla’s to justify incurring the tax expense today.
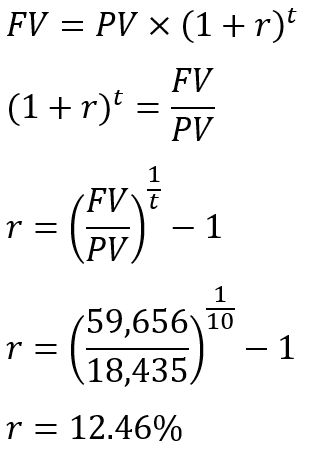
What about a step up in cost basis?
Some readers might be asking, “Well, what about the benefit from the step up in cost basis at death?” Fortunately, we can include this in our analysis. All we need to do is ignore the capital gains tax bill in Step 3 and recalculate the breakeven rate. Looking again at our time value of money formula:
PV – present value
r – growth rate
t – time
As you can see, the hurdle rate increased due to the step up in cost basis at death. You may not get to enjoy the tax benefits, but your heirs will. Including a potential step up in basis will always increase the hurdle rate due to the positive tax benefits, and as a result, many elderly investors will, all other things equal, be better off by holding their highly appreciated investment positions through their death.
Sensitivity Analysis
It’s also important to include some sensitivity analysis in your calculations. For example, what happens if the future rate of return is only 5% per year? Using a spreadsheet, you can readily calculate a range of possibilities to get a better picture:
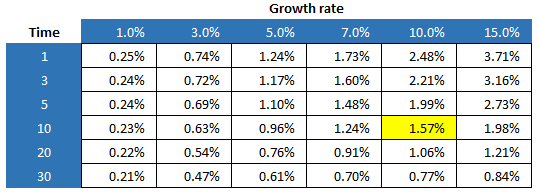
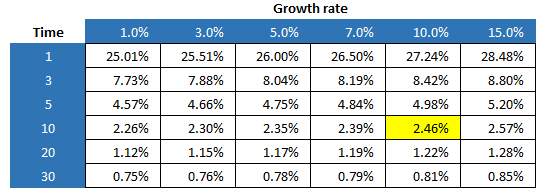
You can see our original results highlighted in yellow. Around them are a variety of alternate scenarios to consider. For example, if you predict that Tesla’s growth rate will stall in the future and end up closer to 1%, then the hurdle rate for a new investment drops down to about 0.25%. A much lower hurdle to jump over. The length of your time horizon also makes a difference, but mainly at higher growth rates. The step up in basis can make a huge difference as well, so if you are an elderly investor don’t be afraid to question any advisor who tells you to sell a highly appreciated investment. At the very least, ask the advisor to calculate the capital gains hurdle rate so you can see where you stand.
A more realistic example
Another way to think about the capital gains hurdle rate is in the context of similar investment funds. Let’s take the popular SPDR S&P 500 ETF (symbol = SPY). This fund has about $427 billion of assets and an expense ratio 0.0945%. Pretty good right? Now lets look at the Vanguard 500 Index (symbol = VOO). VOO has $829 billion of assets and an expense ratio of 0.03%. VOO costs less than a 1/3rd of SPY, but the investments are close to identical. Why does anyone pay more for SPY when they could own VOO for less? The answer comes down to taxes.
Looking at the table below, you can see that if you already own SPY and your position has appreciated by more than 6%, then you’re better off sticking with SPY even though it has a higher expense ratio.

Essentially, the cost of paying the capital gains tax outweighs the extra expense charged by the fund. This is the reason some older investment funds with higher expense ratios are able to hold on to significant assets. The investors in those funds can be considered “tax locked”. In fact, this environment presents a good argument against the effectiveness of capital gains taxes as they force investors into sub-optimal investment choices and limit competition. State Street essentially earns an extra $27.67 million ($429 billion x (0.0945% – 0.03%)) every year due to the friction caused by taxes. And there are plenty of examples like this across the investment management industry.
Here’s one last interesting point. State Street realized that SPY was losing to the competition, so in 2019 they converted another of their funds, the SPDR Portfolio Large Cap ETF (symbol = SPLG) to track the S&P 500 index for an expense of… 0.03%. Right in line with Vanguard and Blackrock. But why didn’t they just lower the expense ratio on SPY? Well, I think you know they had their reasons, about $27 million of them.